Chart Styling - Margin and Padding
In SciChart.js v1.2 and above, we have introduced some properties that let you define the margin/padding inside the SciChartSurface, as well as certain chart parts such as Axis Labels and Axis Titles.
Find out how to set these below.
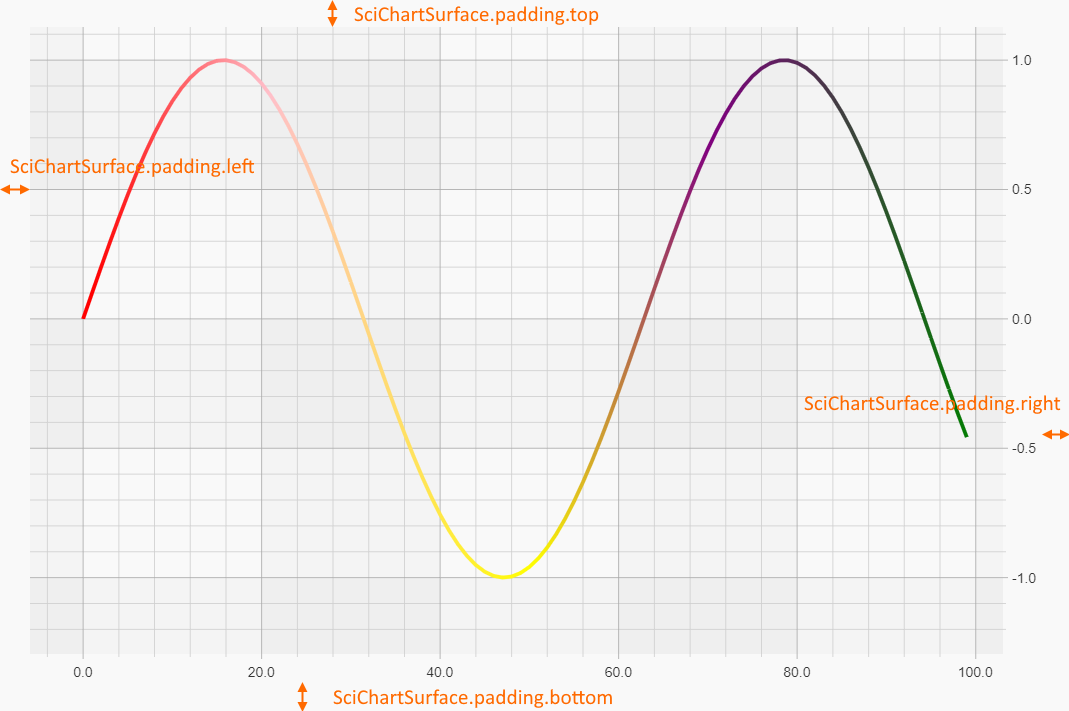
SciChartSurface Padding
The SciChartSurface.padding property can be used to apply a top, right, bottom, left padding to the chart. This defines the spacing around the viewport area and to the chart edge (which includes series, gridlines and axis).
To set the padding, use this code:
// Set padding via Thickness constructor
const { sciChartSurface, wasmContext } = await SciChartSurface.create(divElementId);
const top = 10;
const right = 20;
const bottom = 30;
const left = 40;
sciChartSurface.padding = new Thickness(top, right, bottom, left);

// Set padding via string. Order is Top, Right, Bottom, Left
sciChartSurface.padding = Thickness.fromString("10 20 30 40");

// Set padding via single number. Top=Bottom=Right=Left
sciChartSurface.padding = Thickness.fromNumber(10);
For example, to have a padding of zero and make the chart render right to the edges of it's parent canvas, use this code:
sciChartSurface.padding = Thickness.fromNumber(0);
This results in the following:
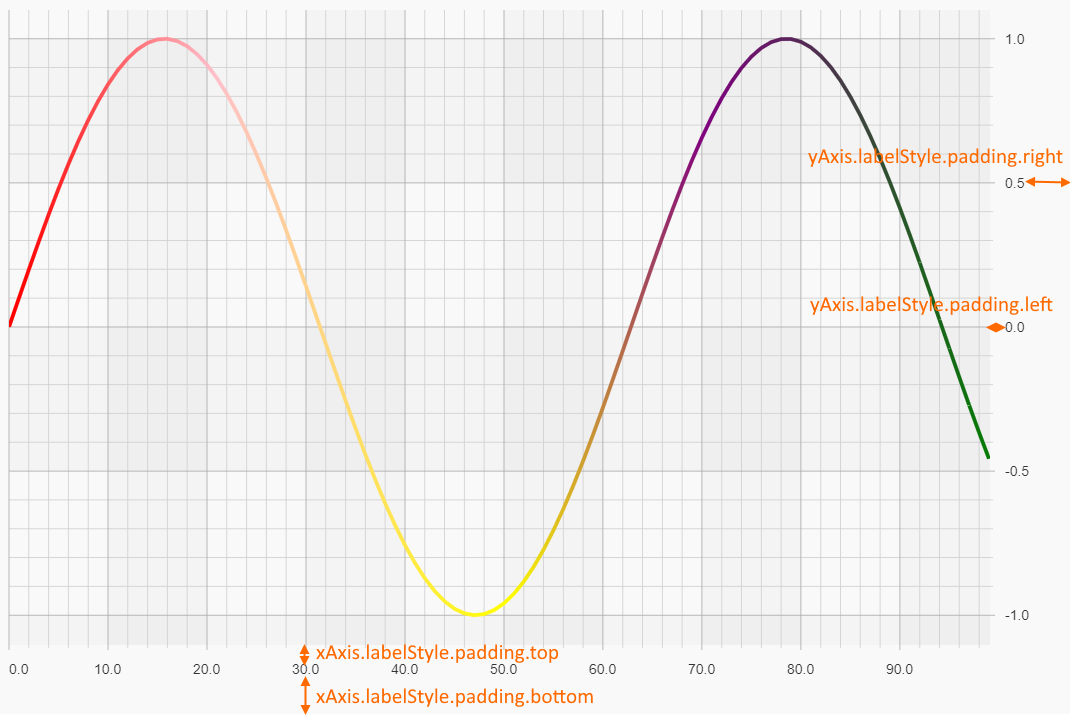
Axis Label Padding
The Axis Labels have a default padding of 4 on all sides. This puts some spacing between the axis and the inner and outer edge of the chart.
Note that horizontal axis ignore axis padding left/right, and vertical axis ignore padding top/bottom.
To set some padding on the axis labels, use the following code.
// Set padding via Thickness constructor
const { sciChartSurface, wasmContext } = await SciChartSurface.create(divElementId);
sciChartSurface.padding = Thickness.fromNumber(10);

const bottomXAxis = new NumericAxis(wasmContext);
bottomXAxis.labelStyle.padding = new Thickness(10, 0, 30, 0);
bottomXAxis.axisAlignment = EAxisAlignment.Bottom;
sciChartSurface.xAxes.add(bottomXAxis);

const rightYAxis = new NumericAxis(wasmContext, { growBy: new NumberRange(0.05, 0.05) });
rightYAxis.labelStyle.padding = new Thickness(0, 30, 0, 10);
rightYAxis.axisAlignment = EAxisAlignment.Right;
sciChartSurface.yAxes.add(rightYAxis);
This results in the following:
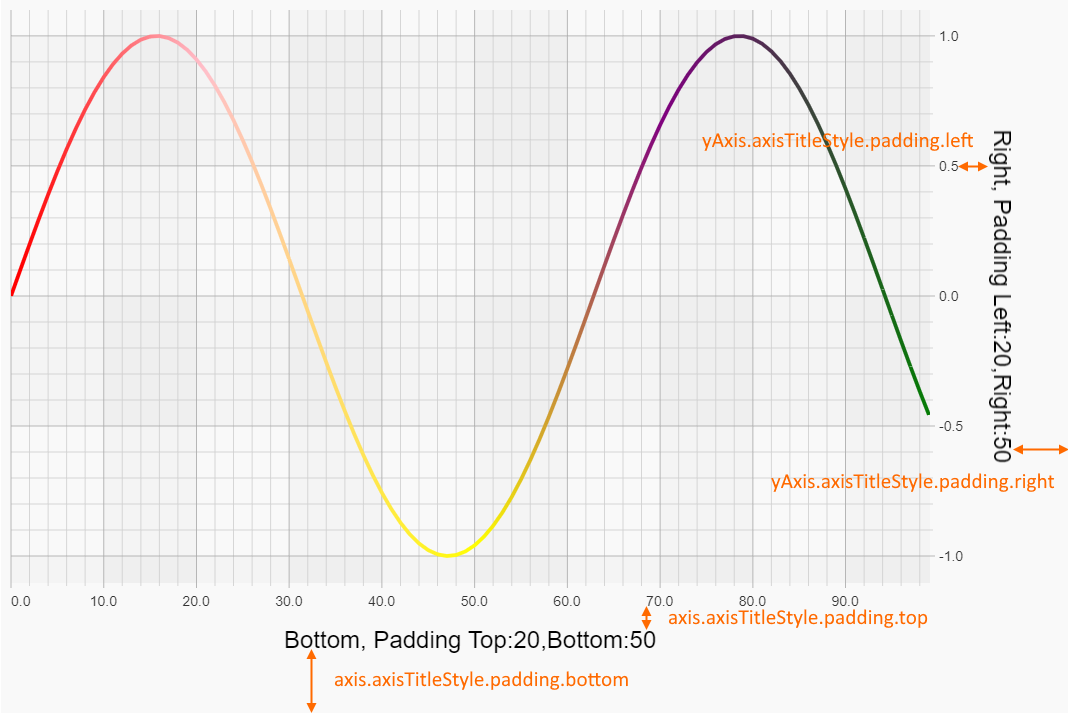
Axis Title Padding
The Axis Titles have a default padding of 6 on all sides. This puts some spacing between the axis title and row of labels and outer edge of the chart.
Note that horizontal axis ignore axis padding left/right, and vertical axis ignore padding top/bottom.
To set some padding on the axis title, use the following code.
const { sciChartSurface, wasmContext } = await SciChartSurface.create(divElementId);
sciChartSurface.debugRendering = false;
sciChartSurface.applyTheme(new SciChartJSLightTheme());
sciChartSurface.padding = Thickness.fromNumber(10);
const bottomXAxis = new NumericAxis(wasmContext);
bottomXAxis.axisTitle = "Bottom, Padding Top:10,Bottom:30";
bottomXAxis.axisTitleStyle.color = "Black";
bottomXAxis.axisTitleStyle.padding = new Thickness(10, 0, 30, 0);
bottomXAxis.axisAlignment = EAxisAlignment.Bottom;
sciChartSurface.xAxes.add(bottomXAxis);
const rightYAxis = new NumericAxis(wasmContext, { growBy: new NumberRange(0.05, 0.05) });
rightYAxis.axisTitle = "Right, Padding Left:10,Right:30";
rightYAxis.axisTitleStyle.color = "Black";
rightYAxis.axisTitleStyle.padding = new Thickness(0, 30, 0, 10);
rightYAxis.axisAlignment = EAxisAlignment.Right;
sciChartSurface.yAxes.add(rightYAxis);
This results in the following: